Crafting Accumulators: Value Detection and Capital Distribution in Tennis and Basketball
Jonas Lang · Jul 31, 2026
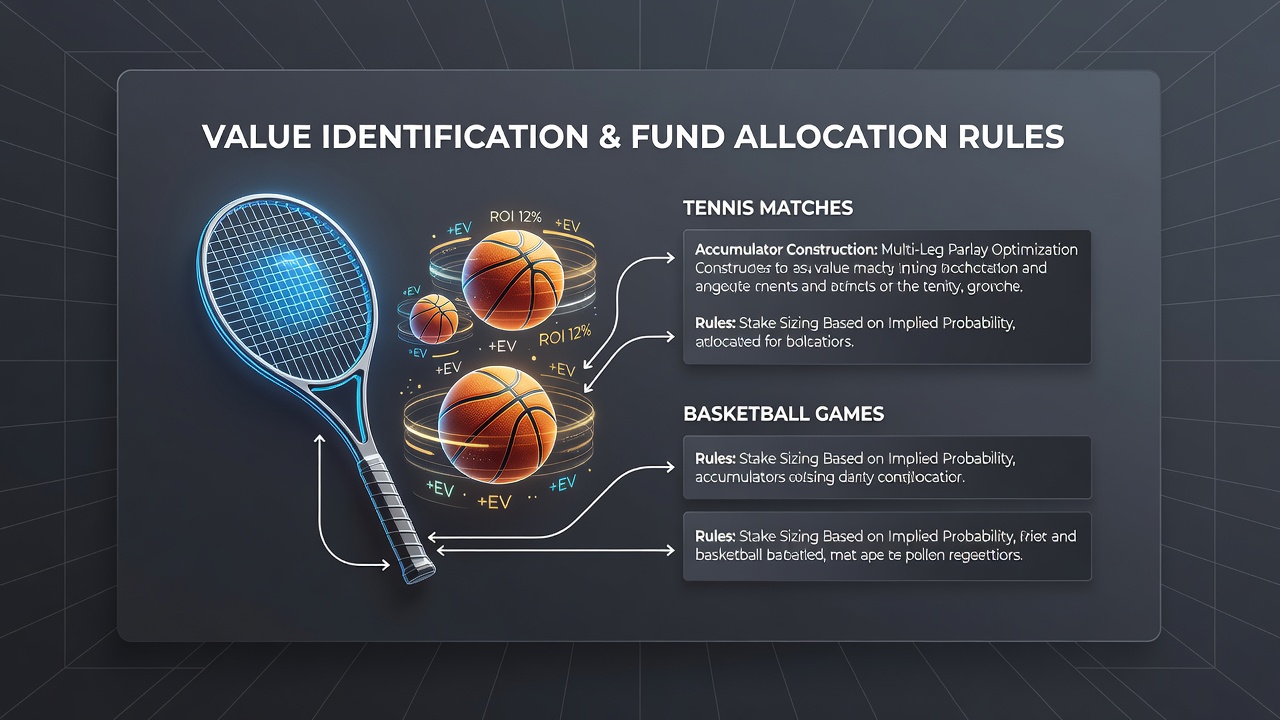
Crafting Accumulators: Value Detection and Capital Distribution in Tennis and Basketball
Experts in sports analytics track how value identification starts when bettors compare implied probabilities from bookmaker odds against calculated probabilities drawn from performance data, surface statistics, and head-to-head records in tennis, while similar processes apply to basketball through pace metrics, shooting efficiency, and injury reports. Data from multiple seasons shows that discrepancies between these figures create opportunities for positive expected value, especially when accumulators combine several selections across both sports. Observers note that tennis matches often feature clearer value windows during grass-court swings in early summer, whereas basketball games provide edges during playoff series where line movements reflect public bias more than underlying team efficiencies.
Core Methods for Spotting Value Across Courts and Courtside
Researchers at institutions such as the Australian Gambling Research Centre have documented that systematic comparison of closing odds against opening lines reveals consistent patterns in tennis, where underdogs on certain surfaces produce value when public money skews toward favorites. In basketball, value emerges from totals markets when teams with strong defensive ratings face opponents in back-to-back situations, and figures reveal these edges compound when selections feed into multi-leg accumulators. Those who study the markets point out that July 2026 schedules place Wimbledon grass events alongside NBA summer league games, creating overlapping windows where bettors can cross-reference player form data between the two sports without waiting for separate seasons.
Fund Allocation Rules That Pair with Identified Edges
Allocation strategies move beyond simple flat stakes once value appears, and practitioners apply percentage-based rules that scale exposure according to the size of the identified edge. The Kelly Criterion adjusted for accumulator variance serves as one framework, where bettors calculate fractional stakes based on win probability minus the break-even point implied by odds, then reduce the fraction further when legs multiply across tennis sets and basketball quarters. Evidence from bankroll simulations indicates that fixed-percentage allocation, typically between one and three percent per accumulator, maintains longevity even when variance spikes during live tournament stretches. Observers note that pairing this discipline with value identification prevents overexposure on correlated tennis and basketball outcomes that share similar momentum factors.
Turn to practical examples and one study revealed that a sample group applying value thresholds above 5 percent combined with strict percentage allocation achieved steadier growth across mixed-sport multis compared with groups using uniform stakes. In tennis, this meant targeting matches where a player’s recent serve-hold percentage exceeded the implied probability from the moneyline, while basketball applications focused on player prop overs when usage rates aligned with defensive matchups. The reality is that both sports share volatility from weather in outdoor tennis and travel fatigue in basketball, so allocation models incorporate buffers for these variables before finalizing stake sizes.

Building Multi-Sport Accumulators with Integrated Rules
Accumulator construction gains structure when value filters apply first to individual legs, then allocation percentages adjust for the combined probability of the full ticket. Data indicates that tennis sets and basketball quarters produce independent outcomes more often than same-sport legs, which reduces correlation risk and allows slightly higher allocation percentages without increasing ruin probability. Those who model these combinations report that limiting tennis selections to best-of-three formats and basketball to regular-season totals keeps variance manageable while still capturing edges from surface transitions and schedule density. July 2026 data windows show increased activity around concurrent events, giving bettors more opportunities to layer selections that meet predefined value criteria before stakes are calculated.
Additional techniques include using Poisson distributions for tennis game totals and regression models for basketball point spreads, both feeding into a unified value score that determines whether an accumulator leg qualifies. Allocation then follows a tiered system: higher-value legs receive the upper end of the percentage range, while marginal edges receive smaller commitments. This approach keeps total exposure across an entire ticket within a single pre-set bankroll segment, adn simulations confirm it supports longer sequences of play without rapid drawdowns.
Conclusion
Patterns across documented seasons demonstrate that value identification paired with disciplined fund allocation produces measurable differences in accumulator outcomes for tennis and basketball selections. By grounding stake decisions in statistical discrepancies rather than intuition, and by scaling exposure through percentage rules that account for multi-leg variance, participants maintain structured approaches to these markets. Continued tracking of performance data through periods such as July 2026 will further refine these methods as new tournament schedules and game logs become available.