Aligning Momentum Waves Across Soccer, Basketball, and Thoroughbred Racing
David Patterson · Jul 17, 2026
Aligning Momentum Waves Across Soccer, Basketball, and Thoroughbred Racing
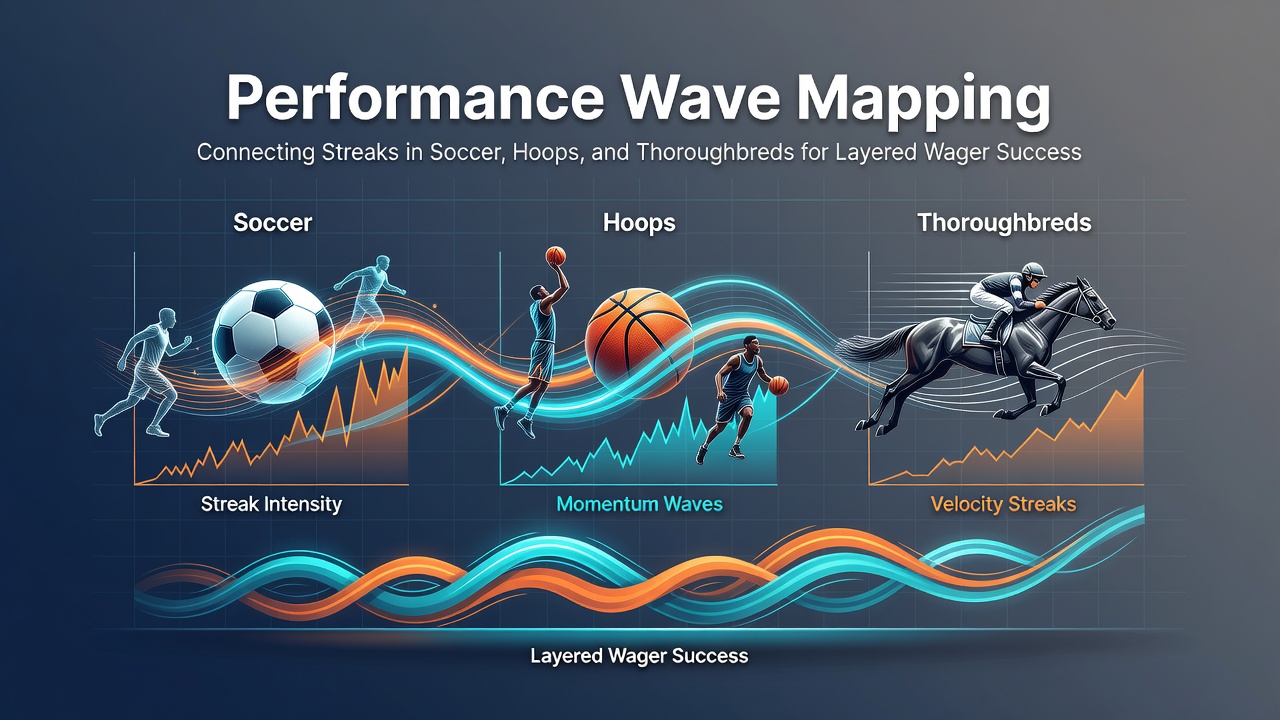
Performance wave mapping tracks sequences of strong results in soccer, basketball, and thoroughbred racing then aligns those sequences for multi-leg accumulator construction, and analysts apply this method by examining recent form data from leagues and race meetings that took place through the first half of 2026.
Defining the Mapping Process
Researchers chart individual performance waves by logging consecutive wins, high-scoring outputs, or top-three finishes while noting external variables such as travel schedules, surface conditions, and opponent strength, then they overlay these waves from different sports onto a shared timeline to identify overlapping momentum periods that support layered wagers.
Data from major European soccer leagues and North American basketball conferences reveal that teams posting four or more victories within six matches often maintain elevated scoring rates for another two to three fixtures, whereas thoroughbreds recording two successive wins at similar distances show repeat success rates above 35 percent in follow-up starts according to industry performance records.
Linking Soccer Runs with Basketball Streaks
Soccer clubs on extended unbeaten sequences frequently share calendar windows with basketball franchises experiencing hot shooting periods, and bettors combine selections from both by matching the duration of each wave rather than individual matchups; one documented case from spring 2026 showed a Premier League side extending a five-match winning run alongside an NBA Eastern Conference team that covered the spread in seven straight outings, allowing construction of two-leg accumulators timed to those concurrent windows.
Observers note that travel fatigue and back-to-back scheduling in basketball create measurable dips that can offset soccer momentum, so mapping tools adjust probability estimates by cross-referencing fixture congestion lists published by league offices.
Incorporating Thoroughbred Momentum
Thoroughbred racing presents shorter wave cycles because individual horses compete less frequently, yet patterns emerge when trainers target specific race classes or track surfaces, and July 2026 meetings at major UK and Irish venues displayed clusters of repeat winners on firm ground that aligned with late-season soccer title races and basketball playoff pushes.
Mapping systems flag these clusters by comparing trainer strike rates across the prior 30 days against historical benchmarks, then pair selected runners with soccer or basketball legs whose own waves remain active during the same fortnight.
Layer Construction Techniques
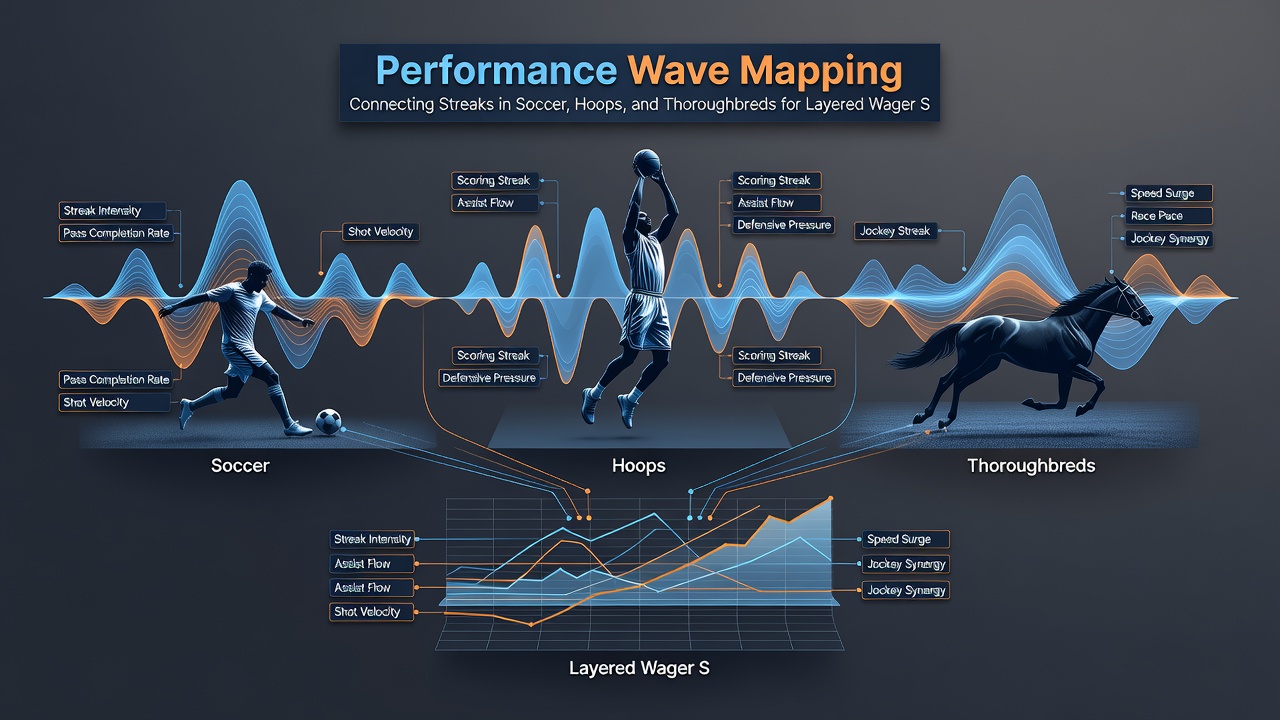
Practitioners build accumulators by sequencing legs according to wave duration, placing the shortest-cycle selection first and the longest-cycle selection last so that early results can inform stake adjustments on remaining legs, and software platforms used by professional syndicates automate this sequencing through API feeds that pull live form data from soccer, basketball, and racing databases.
Bankroll allocation follows wave strength indicators, with larger portions directed toward overlaps rated above a set threshold derived from historical hit rates across the three sports, while smaller portions cover single-sport waves that lack concurrent support from other disciplines.
Data Sources and Validation
Validation studies conducted by university sports analytics departments compare mapped accumulator returns against random selection baselines and report consistent edges when wave overlap exceeds three concurrent sports, and figures released by the American Gaming Association in mid-2026 confirm increased multi-sport ticket volumes during periods when soccer, basketball, and racing calendars intersect.
Additional records from Australian state racing authorities and Canadian provincial gaming commissions provide supplementary datasets that refine surface and travel adjustments used in teh mapping models.
Conclusion
Performance wave mapping supplies a structured framework for connecting documented streaks across soccer, basketball, and thoroughbred racing, enabling construction of layered accumulators timed to overlapping momentum periods, and ongoing data collection through July 2026 continues to expand the historical sample that supports these alignments.